
How
are you
performing?
MORE profitable growers were able to maintain a clear line of sight across all spend, in particular labour and chemicals.

BY BRYN EDWARDS
BENCHMARK LEAD,
VEGETABLESWA
The FY21–22 benchmark findings are out! We reveal how the vegetable industry is responding to changing economic circumstances and where you need to be.
The annual WA Vegetable Industry Benchmarks have been published for the Financial Year 2021–22. Produced by the Building Horticulture Business Capacity Program, the WA vegetable industry now has six years of data (demonstrating consistent trends) to draw on.
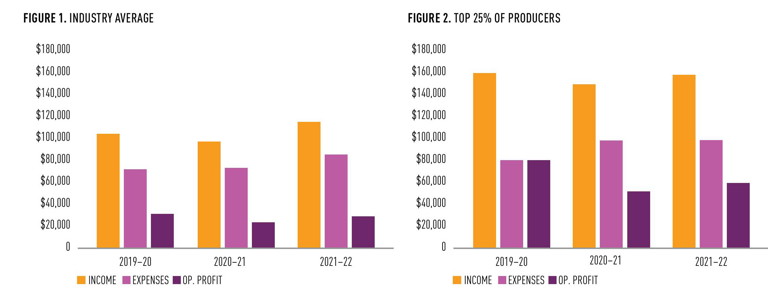
FY2021–22 saw the start of a significant rise in input costs together with labour cost and availability issues. Overall, while industry average performances were generally solid across FY2021–22, there has still been a variety of results (see Figure 1). There is also a deeper concern relating to the impact of the rising cost environment for those who haven’t put in the groundwork to control the costs within their business.
Comparing results of the average producer for FY2021–22 to the previous year, expenses increased about $12,000/ha. However, income increased by about $17,500/ha to produce a $115,000/ha income, which gave growers an average profit of $29,662/ha.
Focusing on the most profitable growers in FY2021–22 (see Figure 2), while the top 25% spent about $13,000/ha more on expenses than the average producer ($157,743/ha), they were able to generate 37% ($42,700/ha) more income from that spend, which translated into $30,000/ha more profit ($59,334/ha) than the average producer.
Looking back, the top 25% profitable vegetable growers managed to control expenses to a similar level to the previous year but returned about $8,500/ha more in income and therefore profit.
“ More profitable growers were able to maintain a clear line of sight across all spend, in particular labour and chemicals, through to saleable yield and therefore income into their business. ”
The key differentiator between the top 25% profitable growers and the average was saleable yield. Often the yield across most of the participating growers was relatively similar, however what differentiated the top 25% was greater levels of saleable yield, which transferred into greater levels of income and then profit.
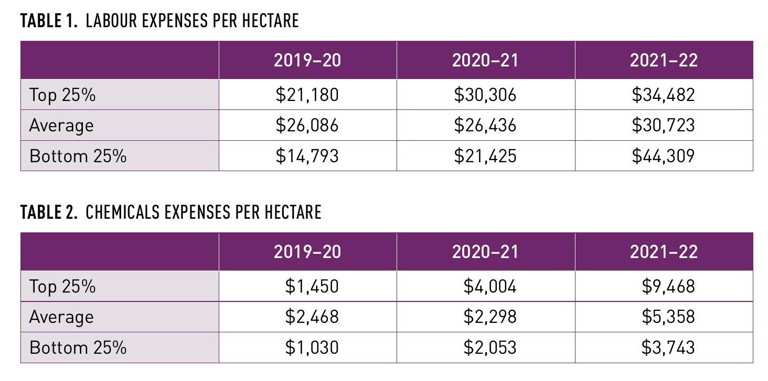
More profitable growers were able to maintain a clear line of sight across all spend, in particular labour and chemicals (see Tables 1 and 2), through to saleable yield and therefore income into their business.
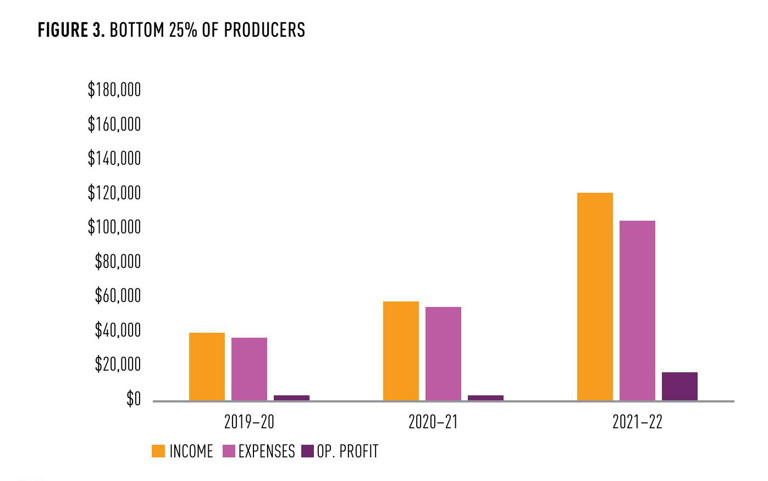
There is a growing concern within the results of the bottom 25% of profitable growers (see Figure 3). Within this group, profit per hectare for FY2021–22 significantly increased nearly five times from the previous two years ($16,821/ha), yet was still below the industry average. On the surface, increased profits are always a positive result. However, it was a function of a doubling in expenses ($105,472/ha) that was met by a dramatic rise in income ($122,293/ha). Note: expenditure for the bottom 25% was larger than the average and top 25% producers.
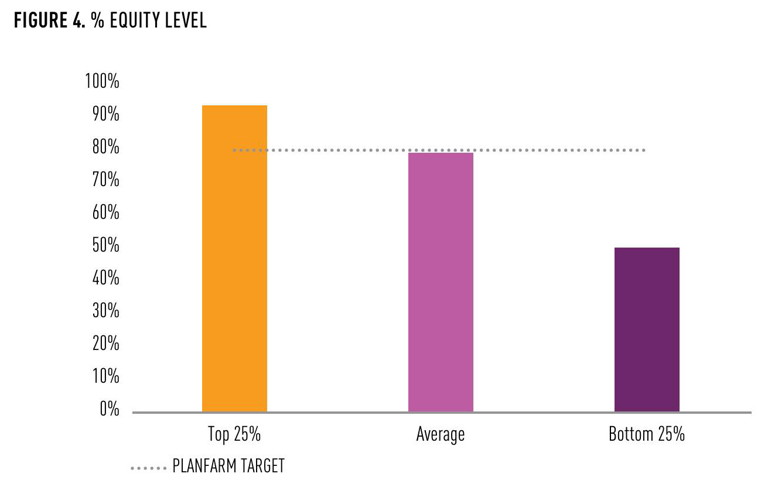
Whether this was a conscious decision or passive consequence of market forces is unclear, however there is concern going into the current FY2022–23 with known continued expenditure rise, whether the general vegetable market will continue to increase prices for produce and whether growers will therefore meet the cost of production. If not, margins will erode impacting equity levels (see Figure 4).
The average equity position for FY2021–22 in the vegetable industry was 79%, with the top 25% being significantly higher at 94%. Both are strong positions that can assist businesses to survive shocks such as negative surplus (deficit) caused from production, market influences or pricing catastrophes.
The bottom 25%, however, is at a worrying 50%, which is a more vulnerable position. If in the current FY2022-23 this cohort does struggle to secure income to meet the known rising input costs, there could be significant impact to the underlying stability within these businesses.
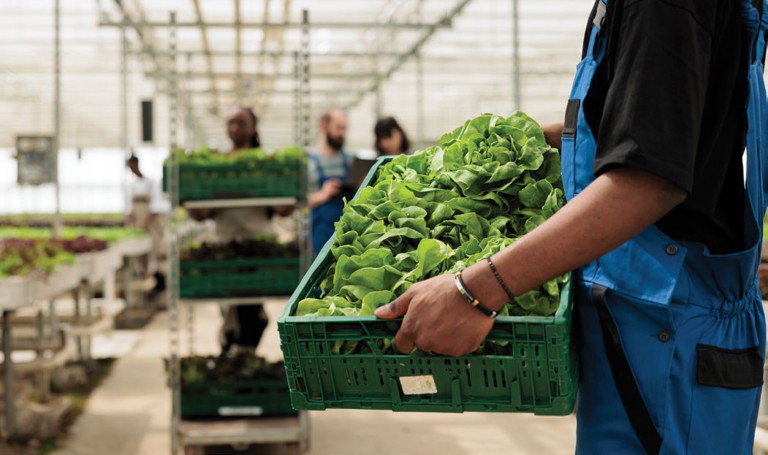
RESULTS showed that keeping the business simple and consistent correlated with higher profitability.
“ The data collected to produce the benchmark results is gathered from the participants of the Building Horticulture Business Capacity Program … it is a possibility the findings of both the top 25% and the average producers point to a ‘leading group’ within the industry and the findings of the bottom 25% are a truer reflection of the wider industry beyond the participating growers. ”
There is also an additional wider concern in the findings. The data collected to produce the benchmark results is gathered from the participants of the Building Horticulture Business Capacity Program. As part of participation, all growers have worked closely with farm management consultants Planfarm for some time to analyse the performance of their businesses and to take the necessary action to maintain or improve margins and profitability. With this context in mind, it is a possibility the findings of both the top 25% and the average producers point to a ‘leading group’ within the industry and the findings of the bottom 25% are a truer reflection of the wider industry beyond the participating growers.
Between these general findings and what is already known about economic conditions in this financial year, now more than ever there is a need for all vegetable business owners to be clear and up-to-date on the details of the cost structure, cost of production and required margins in order to remain profitable and resilient.
Cost cutting is less of an option given the input rise environment that faces the industry. As mentioned above, all spend needs to have a ‘clear line of sight’ of contribution to saleable yield and therefore income for the business.
Similar to the previous year, other key areas that separate the top 25% from the rest and can be easily adopted are:
• Market access and relationships with buyers/customers Assessing markets and determining which best suits your product, location and timing of sales. Producers who have good relationships with their customers or buyers often have greater scope for negotiating pricing, which is vital in the current environment of rising costs.
• Focus on a limited range of products Less is often more. Results showed that keeping the business simple and consistent correlated with higher profitability.
• Business focus A persistent inclination to look more deeply into the business, rather than being in the business, and challenge everything.
Further benchmark detailed data is available, including further six-year findings.
It is strongly recommended to all vegetable business owners to spend some time comparing the performance, spend and income of their own business against the available data to identify in which cohort your own business is performing.
Alternatively, if you wish to undertake a detailed analysis into your own business and access professional support, then please contact Bryn Edwards at vegetablesWA or Paul Omodei at Planfarm, or click on to www.buildingwahorticulture.com.au to check out the program.
The Building Horticulture Business Capacity Program is funded by The Department of Primary Industries and Regional Development, Hort Innovation Frontiers Leadership Funds and the Agricultural Produce Commission pome and vegetables sub-committees.
MORE INFORMATION
More information Contact Bryn Edwards on 0417 409 821 or email bryn.edwards@vegetableswa.com.au.