The heat is on

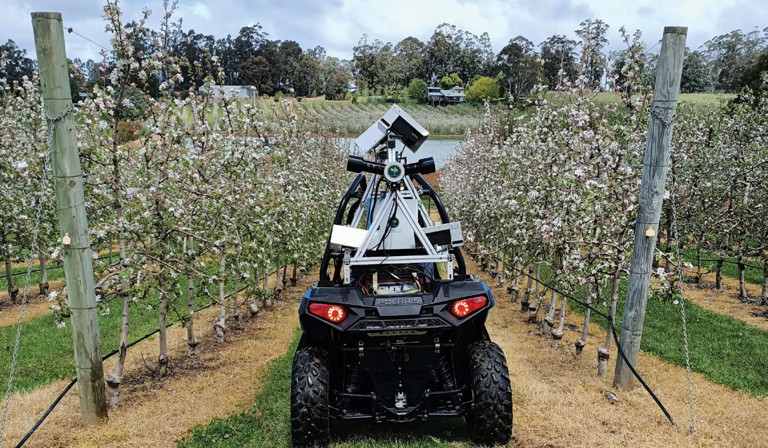
MEET the cartographer: a sophisticated camera is attached to a buggy to capture orchard information.
Will robotic cartographers sending heat maps to orchardists be the future of apple orchard management? DPRID thinks it may well be.

BY DR DARIO STEFANELLI
SENIOR RESEARCH SCIENTIST,
DEPARTMENT OF PRIMARY
INDUSTRIES AND REGIONAL
DEVELOPMENT
Results of a oneyear pilot study in Manjimup to map and monitor orchard growth using new digital imaging technology that delivers information in the form of heat maps have been released.
The study by the Department of Primary Industries and Regional Development (DPIRD), in collaboration with the Agriculture Produce Commission (APC), Pomewest and Aero Vine, was conducted during the 2021–22 season.
The technology is called a ‘cartographer’, which was developed by Australian company Green Atlas and implemented in Western Australia by Aero Vine. It uses a combination of Light Detection and Ranging (LiDAR) data and digital images captured by a sophisticated camera mounted to a buggy (the cartographer) to capture orchard information.
There is great value in the technology when it comes to growers having the capability to achieve set crop load and fruit size targets when planning and managing orchards. The technology visibly identifies poor block performance allowing orchardists the ability to intervene at the required stages to maximise block performance. The images collected with the cartographer generate heat maps that show abundancy of the desired traits. It also produces aerial maps of the orchard, showing spatial variability within the block, allowing for easier block planning and management.
Getting started at bloom
Three bays of 11–13 trees each were selected at bloom, according to their perceived flower density and ranging from high to low for each of the cultivars assessed: ANAPB 01A and Rosy Glow. These had the function of calibrating the cartographer for the generation of heat maps. Performance of the tree bays were regularly mapped and monitored at various stages of development throughout the season (see graphs). Data collection started at bloom and continued during the growing season to map and monitor flowering, canopy growth, fruit growth, fruit counts and fruit colour development.
Flowering
The flowering data was used to select the truthing bays. The Rosy Glow block showed light flowering and setting – way below average, according to the grower – which made it more difficult to relate to a full commercial scale. However, it did not reduce the usefulness of the information. The examples and graphs are mostly focused on the ANAPB 01A block to show the various information gathered from the monitoring.
Canopy growth
Data comprised of information from the cartographer, via the LiDAR technology, will be useful to growers. Information on canopy height will help to understand and plan pruning, both in winter and summer, while canopy area – the space used by the trees – is useful to understand gaps or areas of more or less growth. When monitored in time, this would assist in making decisions regarding irrigation and/or fertilisation, as well as pruning.
Canopy density correlates with the amount of leaves on the trees: the more leaf, the higher the density, and leaf area is a combination of canopy area and density, creating information that Agriculture Victoria was able to correlate with light interception, similar to the effective area of shade. This is important information as the ability of canopies to intercept and harvest sunlight is related to the potential to produce abundant high-quality fruit, so the heat maps can give feedback for pruning canopies for even sunlight capture, or may influence thinning targets, or rates of fruit maturation later in the season.
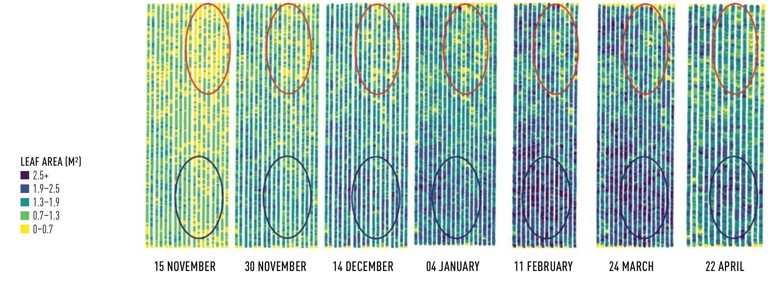
Figure 1 shows the sequence of the leaf area growth in the ANAPB 01A block during the growing season, with lighter colours indicating lower leaf area. The variability is maintained between dates to show the progression of leaf area during the season, which reached the maximum between January and February. The sequence clearly shows that there is an area in the right back corner of sparser canopy (red circle) and an area at the front of higher density (blue circles).
“ The technology visibly identifies poor block performance allowing orchardists the ability to intervene at the required stages to maximise block performance. ”
The same areas with similar patterns were noticeable in the heat maps for canopy height, area, density and fruit numbers (data not shown). This will help in designing ad hoc interventions, such as additional pruning in vigorous trees, increased fertilisation in weaker trees, control level of irrigation in specific patches, crop load adjustments and so on, to try to reduce the variability in the block, once identified.
Fruit size
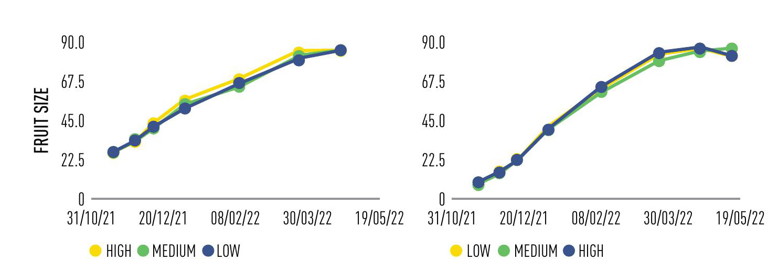
Fruit growth had slightly different behaviour, depending on the cultivar, but there were similar patterns. The bays selected on high-, medium- and low-flower density, as calibration/ ground truthing, were used to monitor fruit growth during the season, check growth patterns and determine eventual differences between areas with higher or lower fruit density. Figure 2 shows fruit size development for ANAPB 01A (left) and Rosy Glow (right).

FIGURE 1.HEAT MAP SEQUENCE OF THE RELATIVE ABUNDANCE OF LEAF AREA GROWTH IN THE ‘ANAPB 01 A ’ BLOCK DURING THE 2021–22 GROWING SEASON. Red circles indicate zones with lower leaf area, while blue circles indicate zones with higher leaf area. Scale indicates the relative abundance.
Source: DPIRD
For Rosy Glow, there were no discernible differences between the fruit coming from the three monitoring bays. For ANAPB 01A , while there were no statistical differences between fruit size coming from the different bays, it was possible to notice a slightly different behaviour with fruit from the bay at low density that were still growing at harvest time while fruit at high density already reached maximum peak. This could help in the logistics of labour if zonal harvests were applied.
Fruit colour
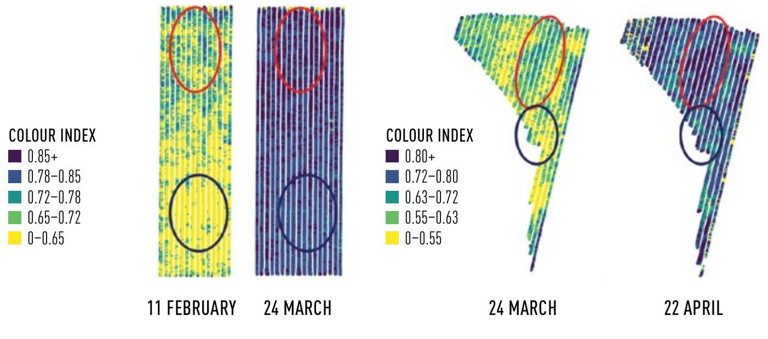
Fruit colour is an important parameter for growers. So much so that actions are regularly performed to improve colour closer to harvest. Understanding the zones in blocks that need additional intervention because of lower colour could be invaluable to growers. Figure 3 shows fruit colour development for ANAPB 01A (right) and for Rosy Glow (left) during the season. Heat maps again show abundance of colour within the image and between dates, indicating colour progression during the season.
Colour is measured through a new index that represents the typical natural progression of fruit as it progresses in maturity towards harvest (developed by researchers at Agriculture Victoria). The Colour Development Index (CDI) is on a scale from 0 to 1, from green to red fruit colouration. As fruit ripens, CDI progresses from low numbers near 0 to higher numbers on this scale to a maximum of 1.
In both blocks, it is clearly noticeable that fruit colour is uneven with areas of more or less red fruit. It is also noticeable that the red colour increased between the two dates, however variability was still present. This information could be useful to adjust interventions aimed to improve colour, such as leaf plucking, canopy pruning/opening or usage of reflective matts.
Fruit quality
Fruit coming from the monitoring bays with high-, medium- and lowflower density were collected at harvest and analysed for quality parameters. There were no statistical differences in fruit size, weight, flesh firmness, Brix or starch index. There was a tendency for fruit from the bays with less fruit to be slightly more sweet and less mature, but not statistically. All fruit was within the commercial parameters for the two cultivars.
“ Information on canopy height will help to understand and plan pruning, both in winter and summer, while canopy area … is useful to understand gaps or areas of more or less growth. ”
Overall, monitoring apple blocks with the cartographer during the growing season delivered highly useful and practical information for growers that could help in achieving the crop load and quality parameters targeted: the heat maps will help growers in understanding the variability in the various blocks and intervene accordingly; variability prior to harvest will assist in picking logistics and directing labour; sequential monitoring will help in understanding the efficacy and efficiency of the interventions.
MORE INFORMATION
Contact Dario Stefanelli on (08) 9777 0158 or email dario.stefanelli@dpird.wa.gov.au.
THANK YOU
The authors would like to thank the apple industry for their support through the APC, Pomewest and Newton Orchards for making available their blocks to run the experiment;, and Aaron Rodwell, of Aero Vine, for the time and effort in collecting and elaborating the data.

FIGURE 3.HEAT MAP SEQUENCE OF THE RELATIVE ABUNDANCE OF COLOUR, MEASURED AS HUE ANGLE IN ANAPB 01 A (RIGHT) AND ROSY GLOW (LEFT) BLOCKS DURING THE 2021–22 GROWING SEASON. Red circles indicate zones with redder fruit, while blue circles indicate zones with fruit with less red colour. Scales indicate the relative abundance.
Source: DPIRD

FIGURE 2.FRUIT SIZE DEVELOPMENT FOR ‘ANAPB 01 A ’ (LEFT) AND ‘ROSY GLOW’ (RIGHT). High, medium and low represent the flower and subsequent fruit density after setting of the chosen bays for monitoring/ground truthing. Graphs were elaborated from data obtained by the Cartographer.
Source: DPIRD