Increasing the accessibility of powerful weather data to growers: DPIRD Weather
BY MICHAEL BARTHOLOMEW | REGIONAL DEVELOPMENT OFFICER, VEGETABLESWA

AGRICULTURE IS UNIQUE in the sense that it is one of the only industries to be influenced by or often at the complete mercy of the weather. Rainfall, temperature, and humidity all play a daily role in deciding how much water is needed, what diseases are present, what time of the day to spray and the quality of the product being grown. Of course, all of that is a gross simplification of the complexity of the interactions present between cropping and the weather but if you’re reading this, you already know that.
Many growers that have been around for any significant period of time tend to develop a ‘sixth sense’ for the weather; an understanding of the patterns and influence that it has over their farm and their decision-making process. But as the climate becomes increasingly variable and weather patterns begin to change and become more extreme and less predictable, the ‘sixth sense’ is no longer enough in a modern production system.
Thankfully, weather data has not only been around for a very long time; it is also completely free. It hasn’t been until recently however, that a weather data service has been developed specifically with agricultural production in mind. The DPIRD Weather website is designed specifically with agricultural production in mind. It comes complete with the accuracy that you would find on the Bureau of Meteorology website but with the simplicity of the weather app that comes with your phone. Unlike traditional weather services, the DPIRD Weather website does not predict the weather into the future, instead it maintains current and historical data of the weather station closest to you. Making it an excellent tool in identifying the climate trends of your growing region.
The most common use for this website is for monitoring rainfall and temperature but there are many other useful features included too. Everything is displayed as a beautiful map overlay, allowing you to easily select your local weather station and see the readings at a glance.
Once you have located your local weather station, selecting it will open up an informative and easy to read dashboard filled with large font and beautiful charts. Better yet, the data is live and updated every minute. Let’s see what it can do.
An excellent tool in identifying the climate trends of your growing region.
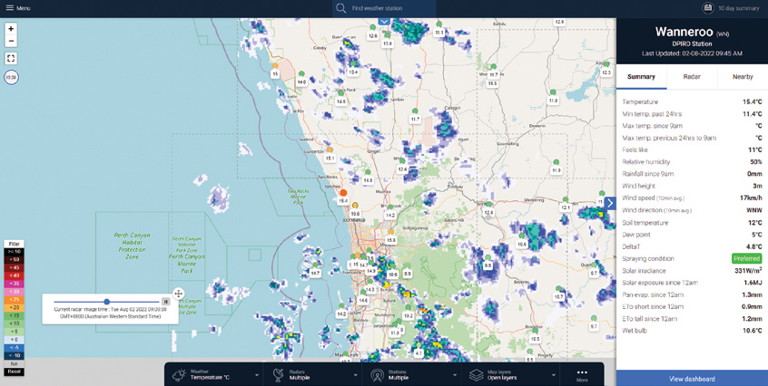
MAIN landing page zoomed in to Perth with the Wanneroo weather station selected and rain radar turned on. Note how the temperature of the Wanneroo station is 15.4 degrees and the panel to the right displays some basic information.
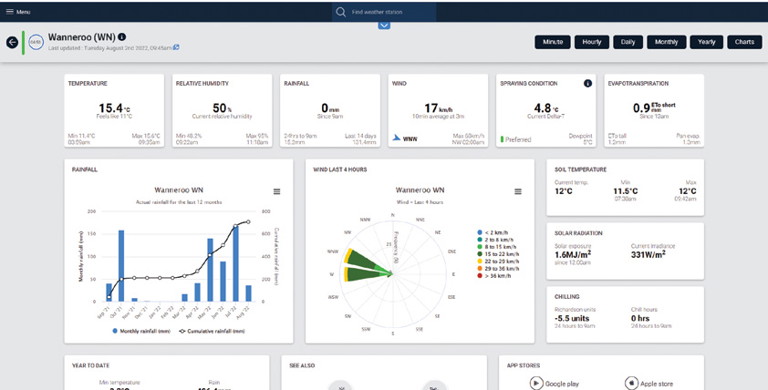
THE main dashboard for the Wanneroo weather station. This dashboard displays data visually and is grouped in such a way that it is easy to read and understand.
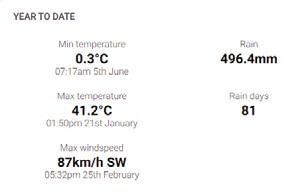
YEAR to date temperature, wind and rain data for the selected weather station.
Temperature and humidity
Open up the website and locate your farm, then locate the nearest weather station on the map identified with a coloured dot. This coloured dot with a number underneath it is the temperature. Clicking on this dot will reveal a page to the right with at-aglance information about the station updated every five minutes.
The most useful information is one click further, click on the blue ‘View dashboard’ button. This shows you the dashboard for your weather station showing you live data.
The top two boxes on the left show temperature and humidity with smaller readouts in the corners showing you minimum and maximum. On the righthand side is another box which shows you soil temperature. To find how this information has changed over time, click on the ‘Charts’ button in the top right. On this page, the top two charts show you a time series chart for the last two weeks for temperature and humidity.
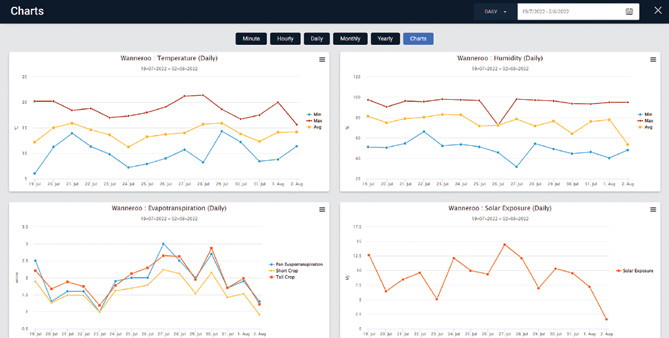
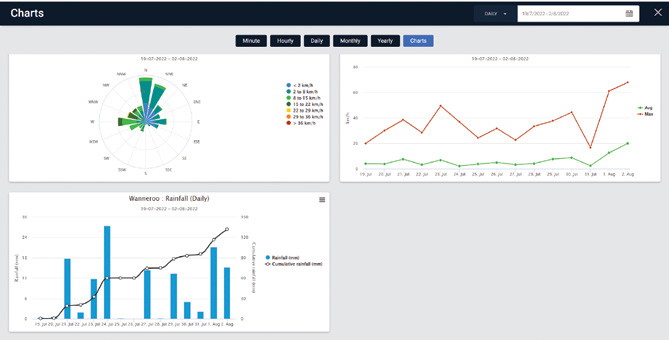
THE charts above visually displays historical timeseries data for numerous weather variables.
Rainfall
Returning to the main map, the first useful rainfall tool is the rain radar. Typically, you would need to access the Bureau of Meteorology website to get this however it can be applied to the map you have here. On the bottom of the map page there is a button with a radar icon on it, click this and then select the radar closest to your location. If you are unsure, hit ‘select all’. This will show you the live rainfall.
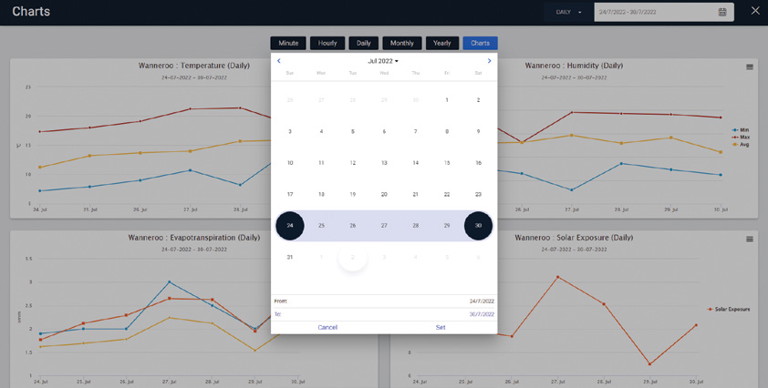
ADJUSTING the date range and measurement intervals for the charts to display.
Let’s select the weather station again and hit ‘View dashboard’. On this dashboard again you can view daily rainfall, yesterday’s rainfall and the total fortnightly rainfall at the top. Centre left is a yearly rainfall chart which shows you monthly and cumulative rainfall. Below that are year to date statistics showing total annual rainfall and the amount of days per year where there was rain. Hitting the ‘Charts’ button once again in the top right then scrolling right to the bottom shows your fortnightly rainfall trends.
Depending on provider, this data is invaluable when using soil moisture monitoring technology on farm, as you can see live how much additional, nonirrigation water is entering the soil profile.
Essentially this provides the ‘proof’ as to if the forecasted weather is accurate enough to base your irrigation timings from.
Spray conditions
The most important factors when working out ideal spray conditions are wind speed and direction, and Delta T. Delta T is a measure of wet bulb and dry bulb temperature which indicates the rate of evaporation or how long a droplet of pesticide will remain liquid. Here, on the right-hand side of the dashboard you can see the ‘Spraying Condition’ box. To make it easy, there is a traffic light system to indicate if the Delta T is ideal for spraying. To the left of that is a wind speed and direction box giving you exactly what information you need at a glance.
Additionally, in the dead centre of the screen is a wind speed rose graph. This provides an easy way to identify the strength and direction of the wind. Generally, wind speeds should be between 5–20km/h and must not be in the direction of settlements or other farms. This is a generalisation however and the exact recommended wind speed varies depending on chemistry, temperature, and droplet size.
This article will not go into too much detail about ideal spray timings, but the Bureau of Meteorology has created an excellent resource to help you determine if the weather is right for spraying, it is available in PDF format here: www.bom. gov.au/info/leaflets/Pesticide-Spraying. pdf
Timeseries data
Click on ‘Charts’ at the top right of the dashboard, then at the top right select the frequency of the data and the desired date range. This will adapt all charts in this section to show you data trends over the timeframe requested. This is an excellent, visual way of understanding the weather patterns that occur in your growing region with absolutely no need to analyse the data yourself, the DPIRD Weather website makes observing historical trends easy. You can even export this data in CSV format for use in other applications by clicking on any of the buttons to the left of charts where it displays the raw data in a table rather than in a chart.
This provides just an overview of the functionality and importance of the data presented on the website, further information is available online on the DPRID website if you would like to learn more. If you would like to check it out, even to satisfy your curiosity or compare your own weather station to a government one nearby visit weather. agric.wa.gov.au and have a look around to see what data might be useful to your farm.
Important factors when working out ideal spray conditions are wind spee d, direction, and Delta T.
MORE INFORMATION
Please contact Michael Bartholomew on 0427 373 037 or michael.bartholomew@ vegetableswa.com.au

This project has been funded by Hort Innovation using the vegetable research and development levy and funds from the Australian Government. For more information on the fund and strategic levy investment visit horticulture.com.au