Rising costs
exposes a key area of concern
within the Horticulture Sector
BY BRYN EDWARDS1AND PAUL OMODEI 2
1 BENCHMARKLEAD, VEGETABLESWA
2 DIRECTOR OF HORTICULTURE, HORTICULTURE CONSULTANT, FARM BUSINESS CONSULTANT
The Building Horticulture Business Capacity Project has recently produced two years of industry averages and benchmarks across FY2019–20 and FY2020–21. The data provides a more detailed understanding of some of the dynamics at play in the Western Australian Horticulture Sector.
TABLE 1. 2 YEAR HORTICULTURE AVERAGES

The project connects horticulture business owners with farm management consultants from Planfarm to conduct a detailed confidential business financial and performance analysis. Each participant then goes through a detailed 1-2-1 review with a consultant to understand their results and identify areas for improved profitability.
The industry averages and benchmarks come from an aggregated analysis across all participants. Although the majority of participants grow either vegetables or pome fruits, the Horticulture analysis also includes stone fruit, avocado, potato and berries production.
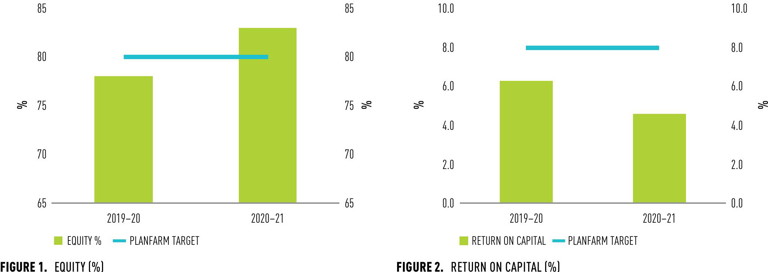
A 2-year average equity level of 81% indicates that balance sheets are in a good position within horticulture businesses (see Table 1 and Figure 1). The 2-year average Return on Capital of 5.5% also demonstrates that the sector can produce good returns compared to other capital investment types, particularly cash returns or the stock market currently (see Figure 2).
However, when comparing year to year there is a decline in average Return on Capital from 2019–20 of 6.3% to 4.6% in 2020–21.
The key issue in the sector becomes apparent when examining the Operating Efficiency results.
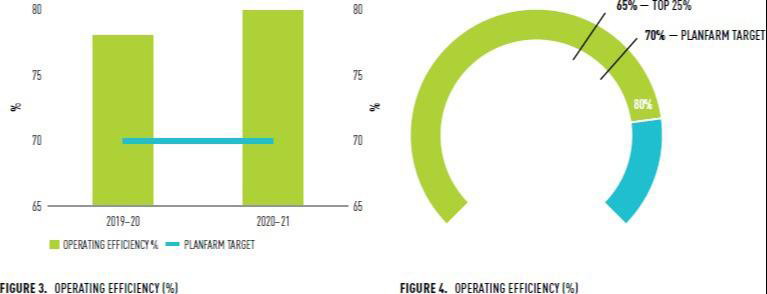
The Operating Efficiency ratio is operating costs as a percentage of operating income. It is a performance gauge of the engine room of any business in terms of profitability. It answers thequestion ‘How many cents is a business spending to make a dollar?’. Obviously the lower the better.
The current 2-year average is at 79% across the sector; 78% in FY2019–20 rising to 80% in FY2020–21 (see Figure 3). This is considered 9% too high compared to a target rate of 70% or less. This means that horticulture business owners are paying 9 cents more than the target 70 cents to make $1.
Why is this an issue? Because 79% leaves minimal capacity — just 21c — to pay depreciation, finance/lease costs, tax and personal drawings, while also retaining some profit in the business.
While the horticulture sector’s results only account for 2 years; this trend is also present throughout the fiveyears of vegetable specific results (see page 12–14). This indicates that weak Operating Efficiency is a ‘live issue’ within businesses in the horticulture sector which has been at play for some time.
The way to address this is to either increase income, decrease operating costs or a combination of both.
However, given the steep rise in input costs that pervade the sector and agriculture at large, business owners cannot afford to ignore this issue before equity becomes eroded through operating and overhead losses.


So, what can you do?
Business owners that deeply understand the cost structure of their business through detailed analysis — as provided by the Building Horticulture Business Capacity Project — can identify quick wins and reshape the cost structure in their business impact of rising input costs to reduce operating costs.
Next is to understand the exact impact of current rising input costs on margins from produce sales. While it might seem obvious, if costs are rising then the price you receive for your produce will need to as well. If this does not happen, then your margins will shrink, and you will quickly find yourself going backwards.Next is to understand the exact impact of current rising input costs on margins from produce sales. While it might seem obvious, if costs are rising then the price you receive for your produce will need to as well. If this does not happen, then your margins will shrink, and you will quickly find yourself going backwards.
In response to the cost increase issue, farm management consultants Planfarm have developed a Cost Analysis Calculator that combines historical financial performanceanalysis over 3 to 5 years specific t o each individual business participating in the project with the current input cost rises to calculate the exact price rise required that business to maintain margin in the current changing environment.In response to the cost increase issue, farm management consultants Planfarm have developed a Cost Analysis Calculator that combines historical financial performanceanalysis over 3 to 5 years specific t o each individual business participating in the project with the current input cost rises to calculate the exact price rise required that business to maintain margin in the current changing environment.
The calculator makes it very clear leaving no doubt what is required from a price rise perspective, and it has been found to place individual business owners in a stronger position for negotiation.The calculator makes it very clear leaving no doubt what is required from a price rise perspective, and it has been found to place individual business owners in a stronger position for negotiation.
Other options that business owners are exploring from the detailed 1-2-1 review with their farm management consultant are options to release some of their equity to invest in operational efficiencies and productivity gains in their production system.Other options that business owners are exploring from the detailed 1-2-1 review with their farm management consultant are options to release some of their equity to invest in operational efficiencies and productivity gains in their production system.
Your first response could be to question these steps, saying to yourself ‘well I do that but I’m still not seeing the returns’. However, there is a cohort of growers that are still producing returns.Your first response could be to question these steps, saying to yourself ‘well I do that but I’m still not seeing the returns’. However, there is a cohort of growers that are still producing returns.
In FY2020–21, which is when challenges started to face the sector, the top 25% of profitable businesses were able to achieve on average a 65% Operating Efficiency. This means that these growers were spending on average 15c less to earn a $1 than the rest of the industry. How are they doing this? By following the same steps mentioned above frequently and rigorously.In FY2020–21, which is when challenges started to face the sector, the top 25% of profitable businesses were able to achieve on average a 65% Operating Efficiency. This means that these growers were spending on average 15c less to earn a $1 than the rest of the industry. How are they doing this? By following the same steps mentioned above frequently and rigorously.
It is also worth noting crop/ variety selection, land size, region or mechanisation did not determine who was in the top 25% cohort.It is also worth noting crop/ variety selection, land size, region or mechanisation did not determine who was in the top 25% cohort.
All further data indicates that with world events, input costs will not be lowering any time soon and will only continue to rise. Therefore, working together to identify all avenues to improve Operating Efficiency across the sector must be a critical priority for individual business owners, industry bodies and industry stakeholders alike.All further data indicates that with world events, input costs will not be lowering any time soon and will only continue to rise. Therefore, working together to identify all avenues to improve Operating Efficiency across the sector must be a critical priority for individual business owners, industry bodies and industry stakeholders alike.
All further data indicates that with world events, input costs will not be lowering any time soon and will only continue to rise. Therefore, working together to identify all avenues to improve Operating Efficiency across the sector must be a critical priority for individual business owners, industry bodies and industry stakeholders alike.All further data indicates that with world events, input costs will not be lowering any time soon and will only continue to rise. Therefore, working together to identify all avenues to improve Operating Efficiency across the sector must be a critical priority for individual business owners, industry bodies and industry stakeholders alike.
Participating in the Building Horticulture Business Capacity Project is a key foundational step on the journey to weathering this storm; primarily for the health of your own business but also for the health of your industry.
Understanding the on margins from produce sales is key
MORE INFORMATION
If you wish to participate in the Building Horticulture Business Capacity Project, then please contact Bryn Edwards at vegetablesWA (bryn.edwards@vegetableswa.com.au) or Paul Omodei at Planfarm (paul@planfarm.com.au).
The Building Horticulture Business Capacity Project is funded by The Department of Primary Industries and Regional Development, Hort Innovation Frontiers Leadership Funds and Agricultural Produce Commission pome and vegetables sub committees.
Working together to identify all avenues to improve Operating Efficiency.
CROP variety selection, land size, region or mechanisation did not determine who was in the top 25% cohort.