How many cents is your business spending to make a dollar?
Patterns of success and concerning trends in the vegetable industry
BY BRYN EDWARDS1AND PAUL OMODEI2
1 VEGETAB LESWA
2 PLANFARM
In an Australian-first dataset, the Building Horticulture Business Capacity Project has collated five years of vegetable industry data, which enables key analysis of WA vegetable growers. The dataset includes two years’ worth of industry averages and benchmarks and three years’ worth of data from the previous Vegetable benchmarking project.
Looking at the five-year averages (see Table 1), there is a respectable 7.4% return on capital and a 76% equity percentage, despite a high Operating Efficiency percentage of 75% within the industry.
Operating efficiency represents operating costs as a percentage of operating income. It is a performance gauge of the engine room of any business in terms of profitability and answers the question: ‘How many cents is a business spending to make a dollar?’.
For the vegetable industry and most horticulture businesses, the target is to be below 70%, which leaves room to cover finance/lease costs, tax, depreciation, management drawings and retain earnings within the business. This target can be achieved by lowering costs or increasing income — or a combination of both.
While these figures are respectable, there is a concerning trend when comparing year against year results.
Despite a steady increase inaverage equity levels over the past five years (see Figure 1), there has been a decline in average return on capital (see Figure 2).
Also, despite varying average operating profit per hectare across the 5 years, the average operating efficiency has remained between 74% and 77%. This means that the industry is not addressing the key issue of turning money spent into more income for their business.
Operating efficiency represents operating costs as a percentage of operating income.
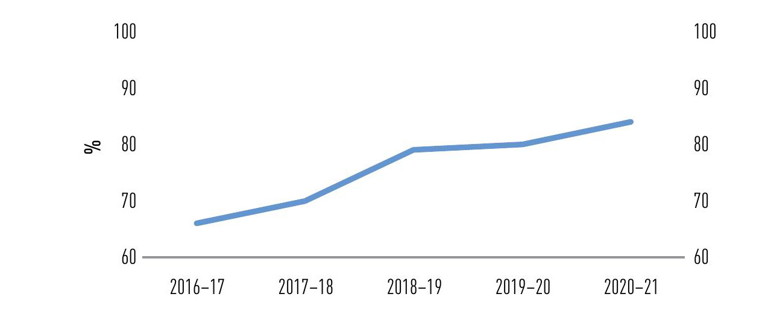
FIGURE 1. 5-YEAR EQUITY %

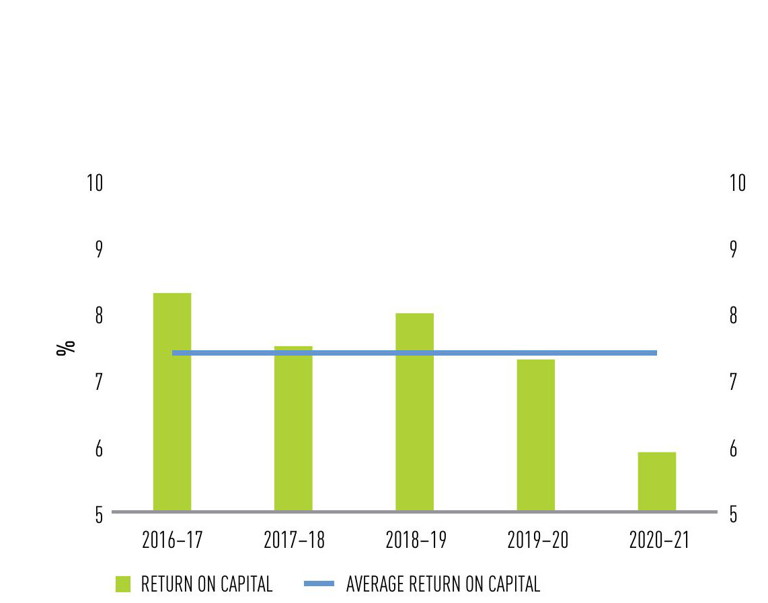
FIGURE 2. 5-YEAR RETURN ON CAPITAL
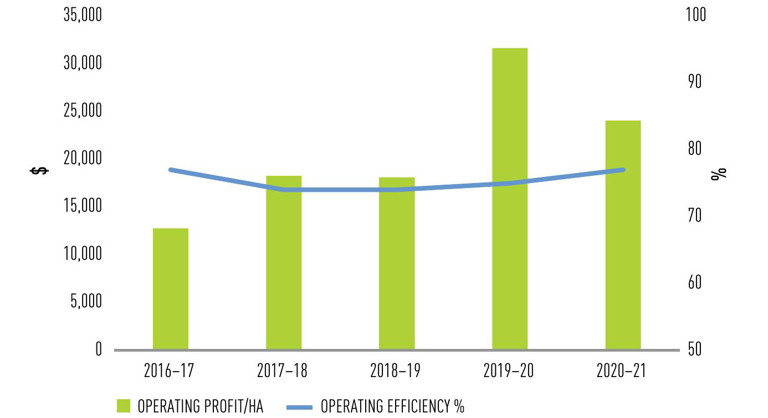
FIGURE 3. ANALYSIS OF OPERATING PROFIT RESULT
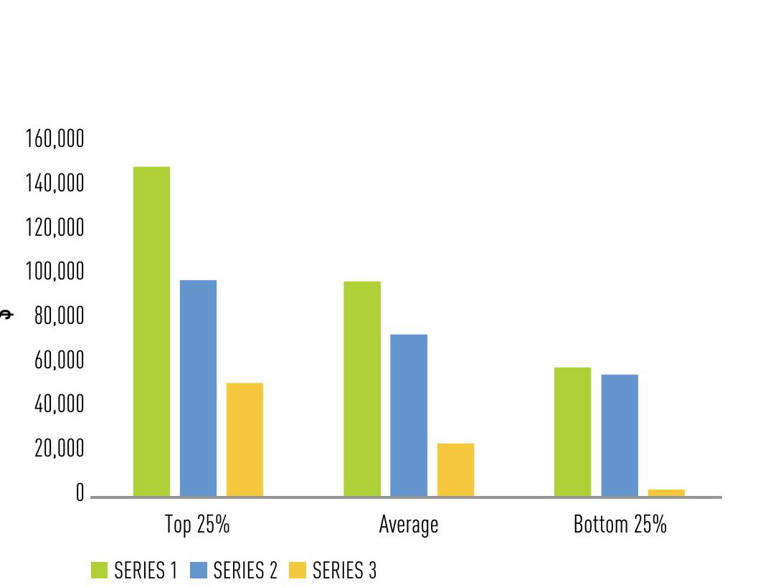
FIGURE 4. INCOME, OPERATING COST AND OPERATING PROFIT (PER HECTARE)
Land values have increased, which would increase value of the asset base and therefore the equity levels. But if the operating efficiency remains unaddressed then there is limited scope to increase operating profit, resulting in a drop in return on capital.
This trend will continue if business owners don’t focus on either avenue to increase price and income and/or release some equity to invest in operational efficiencies and productivity gains in response to the widespread rising input costs.
Despite this, a pattern is emerging among growers who are opposing this trend and showing the way forward by generating strong returns and profits from their efforts (see Figure 3).
The dataset identified a cohort of the top 25% profitable vegetable businesses based on their capacity to generate significantly higher operating profit-perhectare results (see Figure 4). The data indicated these businesses are converting spending into significantly more income than the average business, despite spending the similar amount of money.
The top 25% of an operating efficiency businesse s worked at of 62%.
In the challenging FY2020–21, the top 25% generated on average $52,000 per hectare more income than the industry average which translated into more than twice the level of operating profit per hectare compared to the rest of the industry.
In that year, the top 25% of businesses worked at an operating efficiency of 62% compared to the industry average of 77%. This means is that the top 25% are spending on average 15 cents less than the rest of the industry to make a dollar, which has a huge impact on the retained earnings for a business.
Further analysis of the emerging patterns has identified additional key profit drivers:
• Focus on saleable yield
• Market access and strong relationships with buyers/customers
• Increase land utilisation
• Focus on a limited range of products — Keeping the business simple and consistent correlates with higher profitability. Simplicity also flows into labour use; labour costs were found to represent only 28% of operating costs of Top 25% compared to 33% for the average in FY2020–21.
Another reason identified is that these stronger forward-focused businesses are more inclined to consistently look deeper into their business and are therefore drawn to initiatives such as the Building Horticulture Business Capacity Project to find and address all avenues of improvement.
MORE INFORMATION
If you would like to gain a better understanding of how these trends are impacting your business and undertake a detailed analysis into your own business, then please contact Bryn Edwards at vegetablesWA or Paul Omodei at Planfarm.
The Building Horticulture Business Capacity project is funded by the Department of Primary Industries and Regional Development (DPIRD), Hort Innovation Frontiers Leadership Funds and Agricultural Produce Commission pome and vegetables sub committees.
