Using models
to help predict
future
weather events
EVENTS typically begin to develop during autumn, strengthen in winter/ spring, then decay during summer and autumn of the following year.
Understanding global weather systems that impact Australia’s seasonal climate.
BY HELEN NEWMAN WA BERRY INDUSTRY DEVELOPMENT OFFICER, AGRICULTURAL PRODUCE COMMISSION
Australia is on the receiving end of every El Niño and La Nina event in the Pacific Ocean, so it’s useful to understand what’s driving these events and how they might be predicted.
At BerryQuest 2022, Eric Snodgrass, Science Fellow and Principal Atmospheric Scientist for Nutrien Ag Solutions, explained what drives these climatic changes and the models that can be used to predict them.
This article summarises Eric’s presentation, stepping through the global weather systems that impact Australia’s seasonal climate (El Niño and La Nina and the Indian Ocean Dipole) and the Southern Annular Mode that influences our daily and weekly weather patterns. Links to climate prediction models are provided at the end.
What’s driving these events and how they might be predicted.
What’s driving seasonal weather patterns
Some key things to remember when looking at seasonal weather events are:
• They are driven by changes in the air circulation patterns over the oceans
• Strong winds up well cold water and push warm water away
• Warm air rises over warm parts of the ocean, bringing an increased chance of rain
• Air descends over cooler parts of the ocean leading to lower chances of rain.
El Niño and La Niña explained
In the neutral state (neither El Niño nor La Niña) trade winds blow east to west across the surface of the
Pacific Ocean at their typical speed of 10 nautical miles per hour (about 18km/hr). They bring warm moist air and warmer surface waters towards Indonesia and keep the central Pacific Ocean relatively cool. This pattern is known as the Walker Circulation (Figure 1).
During an El Niño event, trade winds weaken or may even reverse, breaking up the Walker Circulation and allowing the area of warmer than normal water to move into the central and eastern Pacific Ocean (Figure 2). This shuts down the normal rainfall processes over eastern Australia and it gets hotter and drier.
During a La Niña event, the Walker Circulation speeds up and pushes the pool of warmer water over northern Australia. This increases convection over the western Pacific, which increases the probability of rainfall across eastern Australia (Figure 3).
Figure 4 shows changes in the Southern Oscillation Index (SOI) over the past 10 years. The SOI gives an indication of the development and intensity of El Niño or La Niña events in the Pacific Ocean. It’s calculated using the pressure differences between Tahiti and Darwin.
Sustained positive values (in the blue zone) are indicative of La Niña events and sustained negative values (in the red zone) indicative of El Niño.
Events typically begin to develop during autumn, strengthen in winter/spring, then decay during summer and autumn of the following year.
Normally La Niña events, like the one we are in right now, are double dippers, occurring for two years in a row. Occasionally they occur more than twice in a row as happened in successive years from 1998–99 to 2001–02. We are currently sitting in another La Niña pattern, with a La Niña event recorded in 2020–21 and again in 2021–22.
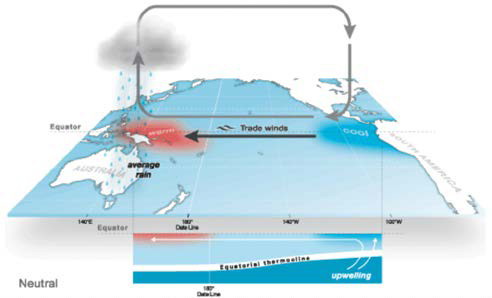
FIGURE 1. THE NEUTRAL PHASE OF THE WALKER CIRCULATION SHOWING THE AIR MOVEMENT CYCLE AND UPWELLING OF COOL WATER OFF THE EAST COAST OF SOUTH AMERICA.
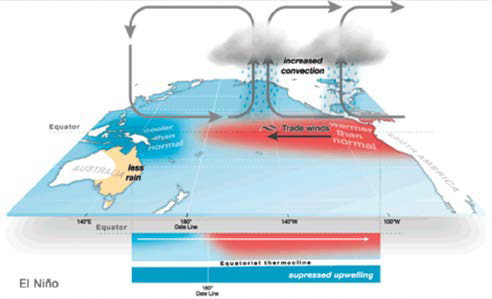
FIGURE 2. AIR MOVEMENT AND OCEAN TEMPERATURES DURING AN EL NIÑO EVENT.
Source: Bureau of Meteorology.
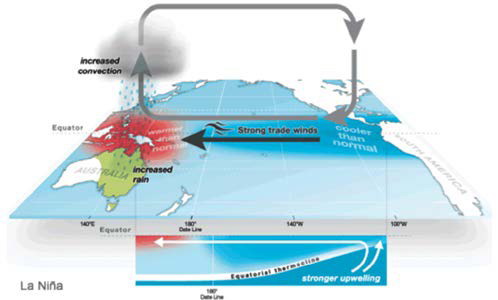
FIGURE 3. AIR MOVEMENT AND OCEAN TEMPERATURES DURING AN LA NIÑA EVENT.
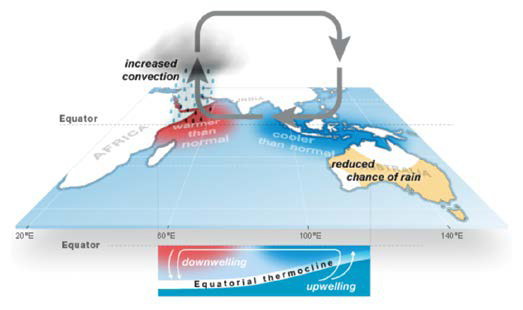
FIGURE 6. AIR MOVEMENT AND OCEAN TEMPERATURES DURING AN INDIAN OCEAN DIPOLE POSITIVE PHASE.
Source: Bureau of Meteorology.
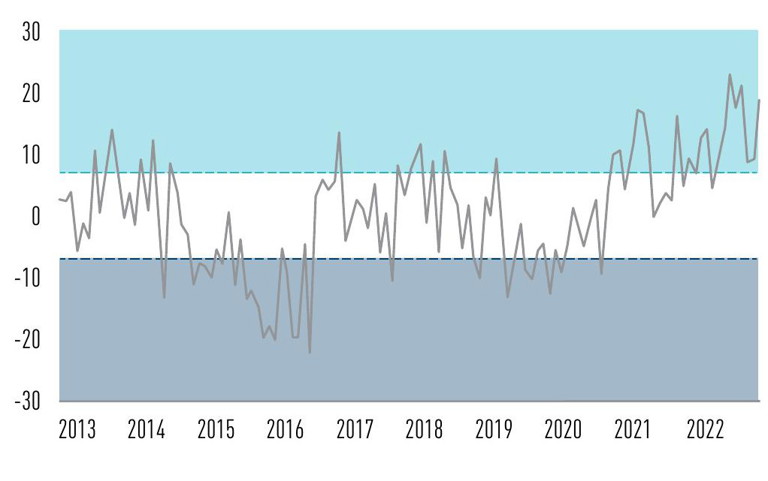
FIGURE 4. SOUTHERN OSCILLATION INDEX CHANGES OVER THE LAST 10 YEARS. SUSTAINED NEGATIVE VALUES LOWER THAN −7 OFTEN INDICATE EL NIÑO EVENTS, SUSTAINED POSITIVE VALUES GREATER THAN +7 ARE TYPICAL OF LA NIÑA EVENTS.
Source: Bureau of Meteorology.
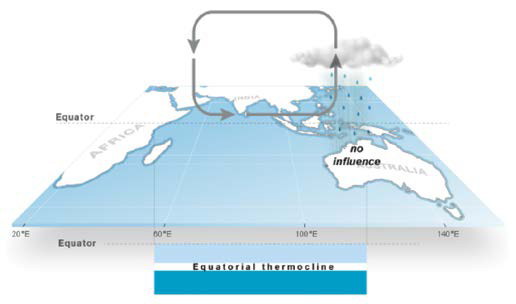
FIGURE 5. AIR MOVEMENT AND OCEAN TEMPERATURES DURING AN INDIAN OCEAN DIPOLE NEUTRAL PHASE.
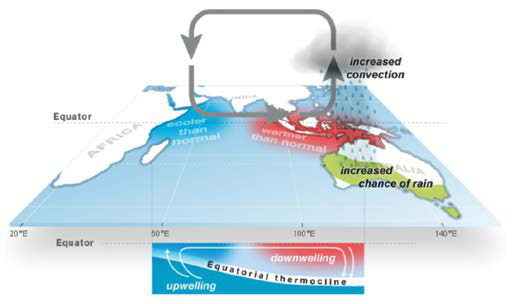
FIGURE 7. AIR MOVEMENT AND OCEAN TEMPERATURES DURING AN INDIAN OCEAN DIPOLE NEGATIVE PHASE.
Indian Ocean Dipole (IOD) explained
On the other side of Australia, the Indian Ocean responds in-kind to changes in the Walker Circulation, flipping back and forth in its own El Niño/La Niña-like cycle known as the Indian Ocean Dipole (IOD). Positive phases of the IOD usually correspond with El Niño events and negative IOD with La Niña events.
When the IOD is in its neutral phase, water from the Pacific flows between the islands of Indonesia, keeping seas to Australia's northwest warm (Figure 5). Air rises above this area and falls over the western half of the Indian Ocean basin, blowing westerly winds along the equator. Temperatures are close to normal across the Indian Ocean, and hence the neutral IOD results in little change to Australia’s climate.
When the IOD is in its positive phase, westerly winds weaken along the equator allowing warm water to shift towards Africa (Figure 6). Changes in the winds also allow cool water to rise up from the deep ocean in the east. This sets up a temperature difference across the Indian Ocean with cooler than normal water in the east and warmer than normal water in the west. Generally, this means there is less moisture than normal in the atmosphere to the northwest of Australia. This changes the path of weather systems coming from Australia's west, often resulting in less rainfall and higher than normal temperatures over parts of Australia during winter and spring.
When the IOD is in its negative phase, westerly winds intensify along the equator, allowing warmer waters to concentrate near Australia (Figure 7). This sets up a temperature difference across the Indian Ocean, with warmer than normal water in the east and cooler than normal water in the west. This typically results in above-average winter–spring rainfall over parts of southern Australia as the warmer waters off northwest Australia provide more available moisture to weather systems crossing the country.
Figure 8 shows changes in the IOD over the last four years. The peaks seen in 2019 correspond with the hottest day on record (Australian national average temperature of 41.6ºC) on 18 December 2019 and the severe 2019 bushfires in eastern Australia. The bottom right-hand side of the chart shows where we are now, in a strong negative IOD phase with corresponding high rainfall and flooding along the east coast.
Cycles of air movement and resulting sea temperature changes can be seen on satellite sea surface temperature anomaly charts like the one presented in Figure 9, which was captured on 23 October. The dark blue colouration seen in the central and eastern Pacific Ocean is cold water being upwelled by the very strong trade winds blowing from the east (typical of La Niña). Warm ocean temperatures can be seen to the north of Australia, where there will be an upwelling of warm air which results in increased rainfall in eastern Australia. Cooler ocean temperatures can be seen towards Africa in the western Indian Ocean, typical of the IOD Negative Phase.
What drives sub-seasonal weather patterns
To the south of Australia, there is another wind band that influences rainfall and temperatures. These are the westerly winds that bring weather events up from the Southern Ocean. The northsouth movement of this westerly wind band is called the Southern Annular Mode (SAM). Phases of SAM can last from a week up to several months and are used to predict weather conditions on a finer scale (daily up to three weeks). Figure 10 summarises the phases of the SAM in summer and winter, how they influence rainfall and temperature patterns and how they interact with El Niño and La Niña events.
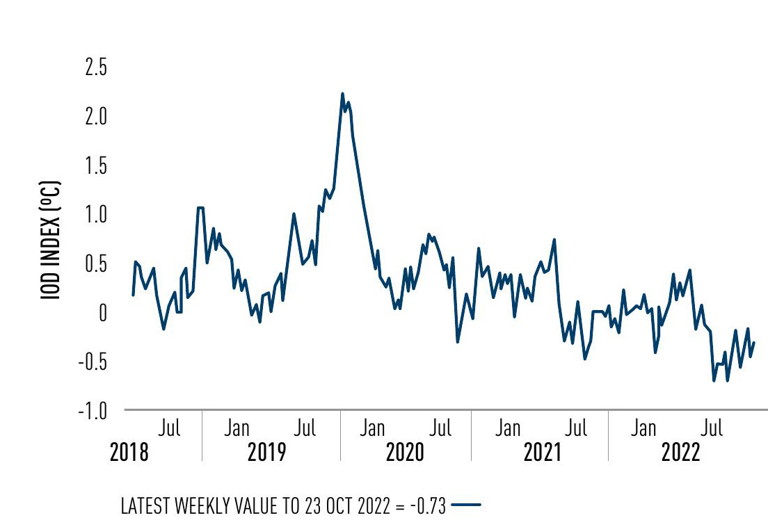
FIGURE 8. INDIAN OCEAN DIPOLE (IOD) INDEX TIME SERIES.
Source: Bureau of Meteorology.
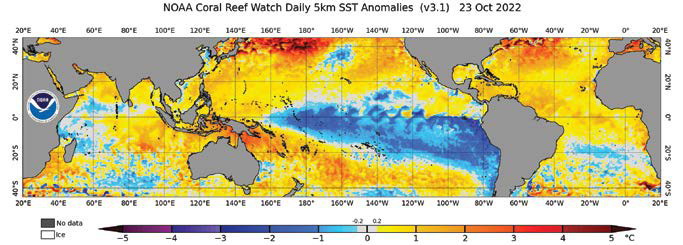
FIGURE 9. SEA SURFACE TEMPERATURE ANOMALIES ON 23 OCTOBER 2022 SHOWING STRONG LA NIÑA AND IOD NEGATIVE PHASE PATTERNS.
Source: NOAA Coral Reef Watch.
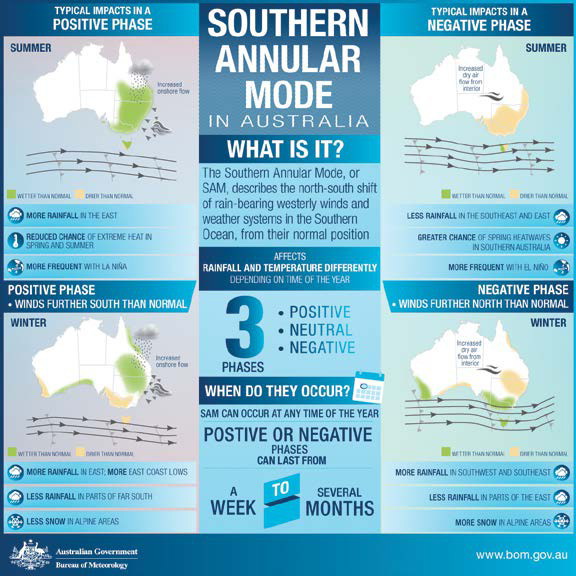
FIGURE 10. SOUTHERN ANNULAR MODE IN AUSTRALIA.
Source: Bureau of Meteorology.
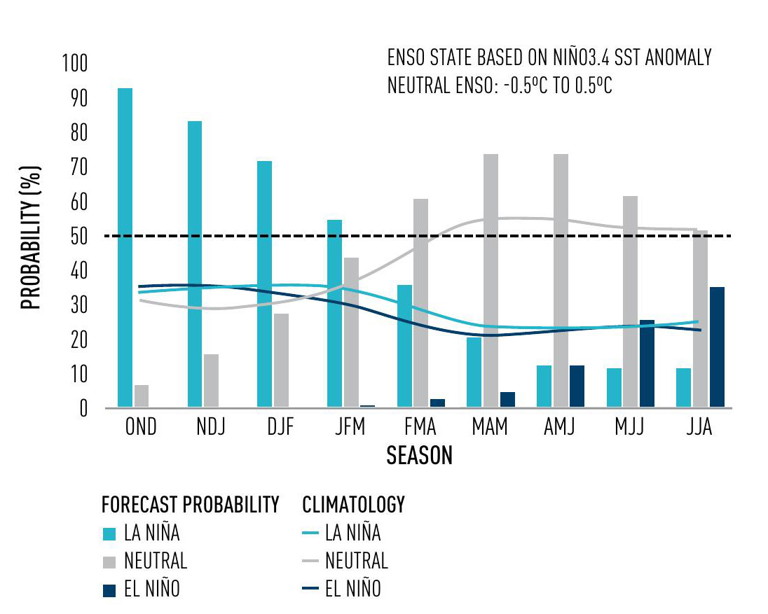
FIGURE 11. MODEL-BASED IRI ENSO PROBABILITY FORECAST SHOWING THE LIKELIHOOD OF LA NIÑA, NEUTRAL AND EL NIÑO DEVELOPMENT.
Source: Columbia Climate School
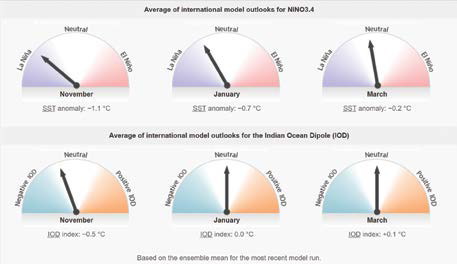
FIGURE 12. BUREAU OF METEOROLOGY PRESENTATION OF INTERNATIONAL LA NIÑA AND EL NIÑO AND IOD PREDICTIONS.
Climate prediction models
There are many good climate prediction models used throughout the world and Australia’s own Bureau of Meteorology is considered world-class. These models predict the behaviour of the major climate drivers and provide rainfall and temperature pattern predictions. The more similar these models are to one and other, the more confidence you can have in the predicted long-range outlook.
Looking ahead at the next 12 months, international models are predicting a shift away from La Niña and movement towards a neutral pattern in early 2023 (Figure 11).
This model is updated each month and can be found on the Columbia Climate School website.
The Australian Bureau of Meteorology also provides summaries of international climate model predictions (Figure 12) as well as their own predictions on their Climate Driver Update page. You can view their long-range temperature and rainfall forecasts on their Climate Outlooks page (Figure 13).
Australia’s Bureau of Meteorology climate prediction models are considered world-class.
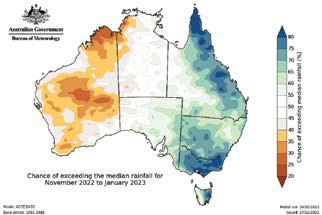
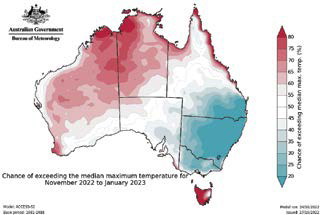
FIGURE 13. BUREAU OF METEOROLOGY 3-MONTH PREDICTIONS (FROM NOVEMBER 2022 – JANUARY 2023) FOR ABOVE MEDIAN RAINFALL AND TEMPERATURES ACROSS AUSTRALIA.
MORE INFORMATION
Eric provides fortnightly weather forecast videos that focus on what the key climate indicators are doing and how they are likely to influence weather conditions and outlooks in Australia. These updates can be accessed on the Nutrien
Ag Solutions YouTube channel. www.youtube.com/channel/ UCU48qpBvX4mJAvZ1Hmi9rCw
You can hear the presentation Eric Snodgrass gave at BerryQuest online below:
This article has been reproduced with permission from Berries Australia.
REFERENCES
International sources:
• Sea Surface Temperature Anomaly charts, United States National Environmental Satellite Data and Information Service — NOAA Coral Reef Watch Daily Global 5km Satellite https:// coralreefwatch.noaa.gov/product/5km/index_5km_ssta.php
• ENSO Forecast, Columbia Climate School http://iri.columbia.edu/our-expertise/climate/forecasts/enso/current/
Bureau of Meteorology sources:
• Understanding the El Niño Southern Oscillation (ENSO) www.bom.gov.au/climate/enso
• Understanding the Indian Ocean Dipole (IOD) www.bom.gov.au/watl/ about-weather-and-climate/australianclimate-influences.shtml?bookmark=iod
• Understanding the Southern Annual Mode (SAM) www.bom.gov.au/climate/sam
• Indian Ocean Dipole (IOD) index time series www.bom.gov.au/climate/enso/indices.shtml?bookmark=iod
• Southern Oscillation Index (SOI) since 1876 www.bom.gov.au/climate/enso/soi
• Climate Driver Update www.bom.gov.au/climate/enso
• Climate outlooks www.bom.gov.au/climate/outlooks/#/overview/summary


